Interpreting Historical Weather Summaries
[!NOTE] Review the historical climate record before generating stochastic parameters to verify record completeness and identify potential gauge anomalies.
The Historical Data Analysis card summarizes the loaded weather observations using statistical metrics and charts.
Key Metric & Quality Cards
At the top of the Historical panel, the summary banner and metric cards report:
- Record Length & Completeness: Shows total calendar years (e.g., May 1, 1985 to June 8, 2020), overall data completeness percentage ($98.4\%$), and total missing observation days.
- Max 1-Day Peak: The single largest 24-hour storm depth recorded in the gauge history (e.g., $1.86\text{ in}$).
- Max Dry & Wet Spells: The longest continuous stretch of consecutive dry days ($55\text{ days}$) and consecutive wet storm days ($10\text{ days}$).
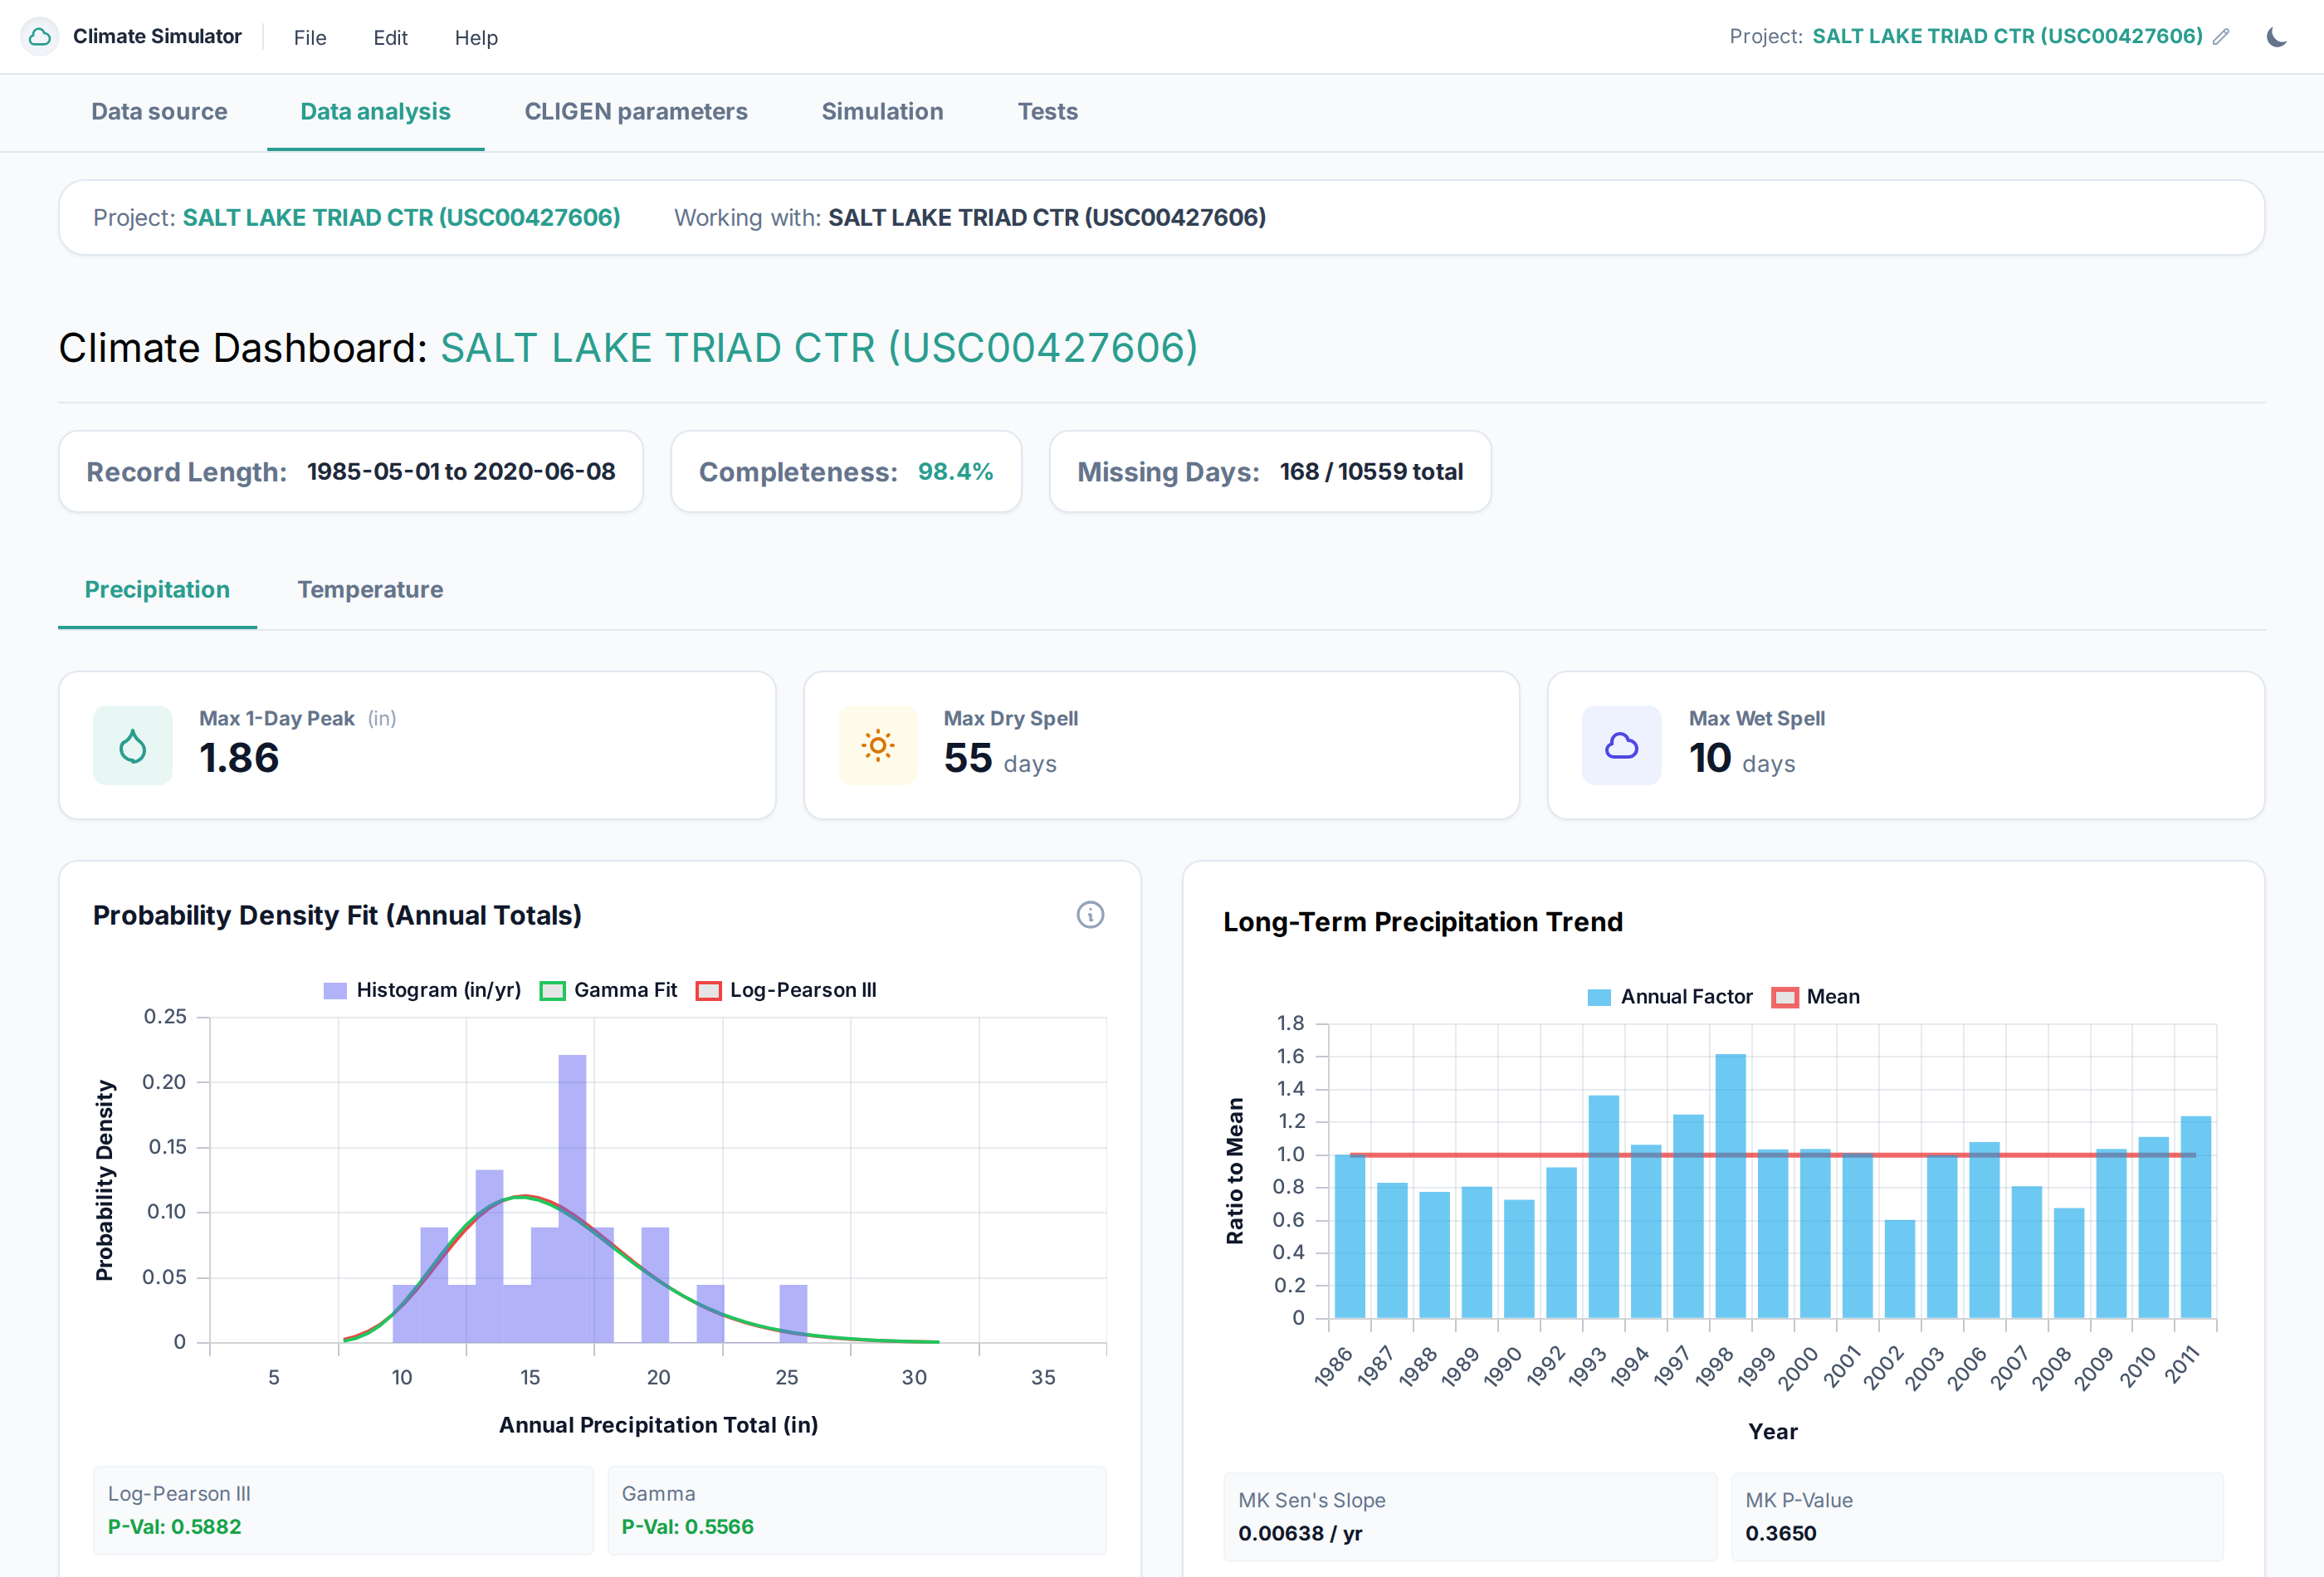 Figure 1: The Historical Data Analysis dashboard showing record completeness, peak storm metrics, probability density fitting (Log-Pearson III vs. Gamma), and long-term precipitation trend analysis.
Understanding the Charts
1. Historical Daily Precipitation Time History
The full-width Historical Daily Precipitation Time History chart displays the complete daily rainfall series across the period of record and provides interactive controls for inspecting individual storms and multi-year wet or dry periods:
- Max-Preserving Display at Full Record Scale: Multi-decade daily records contain tens of thousands of days, which exceeds the horizontal pixel resolution of a browser canvas. When viewing a window wider than $1{,}500\text{ days}$, the chart groups adjacent days into compact time buckets and plots the maximum 1-day precipitation depth within each bucket rather than the average. This ensures single-day cloudbursts and extreme storm spikes remain visible at their full recorded height when zoomed out. Once you zoom into a window of $1{,}500\text{ days}$ ($\approx 4\text{ years}$) or less, the chart automatically switches to 1:1 daily bars.
- Zooming & Panning:
- Drag-to-Zoom & Scroll Wheel: Click and drag horizontally across the main chart canvas to zoom into a specific date span, or use the mouse scroll wheel over the chart.
- Overview Brush Scrubber: Directly beneath the main chart, the compact timeline bar shows the full historical record. Drag the highlighted window left or right to pan across decades, or drag its left and right handles to widen or narrow the active date range.
- Time-Window Presets & Stepper: Use the
All,10Y,5Y,1Y,Wettest Yr, andDriest Yrbuttons to snap to standard durations, and click the←/→arrows to step the current window backward or forward through the record. - Jump to Top 10 Peak Storms: The storm selector dropdown lists the 10 largest distinct 1-day storm events in the gauge record by date and depth. Selecting an event zooms the chart to a 90-day ($\pm 45\text{-day}$) window centered on that storm.
- Overlays & Window Summary:
- 30-Day Rolling Sum: Toggles a secondary-axis line showing the trailing 30-day cumulative precipitation to highlight seasonal wet periods and multi-day storm clusters.
- $\ge 99\text{th}$ Percentile Peaks: Highlights daily storm totals at or above the 99th wet-day percentile in rose red.
- Window Summary Cards: The four cards below the timeline dynamically report the visible window's total day count, cumulative precipitation, wet-day count and percentage, and maximum 1-day storm depth and date.
2. Probability Density Fit & Long-Term Trend
- Annual Precipitation Probability Density: Aggregates daily observations into annual rainfall depths and fits theoretical probability distributions:
- Gamma Distribution (2-Parameter): Benchmark hydrologic curve bounded at zero.
- Log-Pearson Type III (LP3): Recommended by USGS Bulletin 17B/17C for modeling hydrologic skewness and rare flood/drought tails.
- K-S Goodness-of-Fit Test: Kolmogorov-Smirnov test p-values ($p > 0.05$ indicates strong agreement between the historical gauge record and the theoretical distribution).
- Long-Term Trend Analysis: Uses the Mann-Kendall test and Sen's Slope estimator to determine whether precipitation shows a statistically significant upward or downward trend over decades.
3. Monthly Precipitation Extremes & Wet/Dry Days
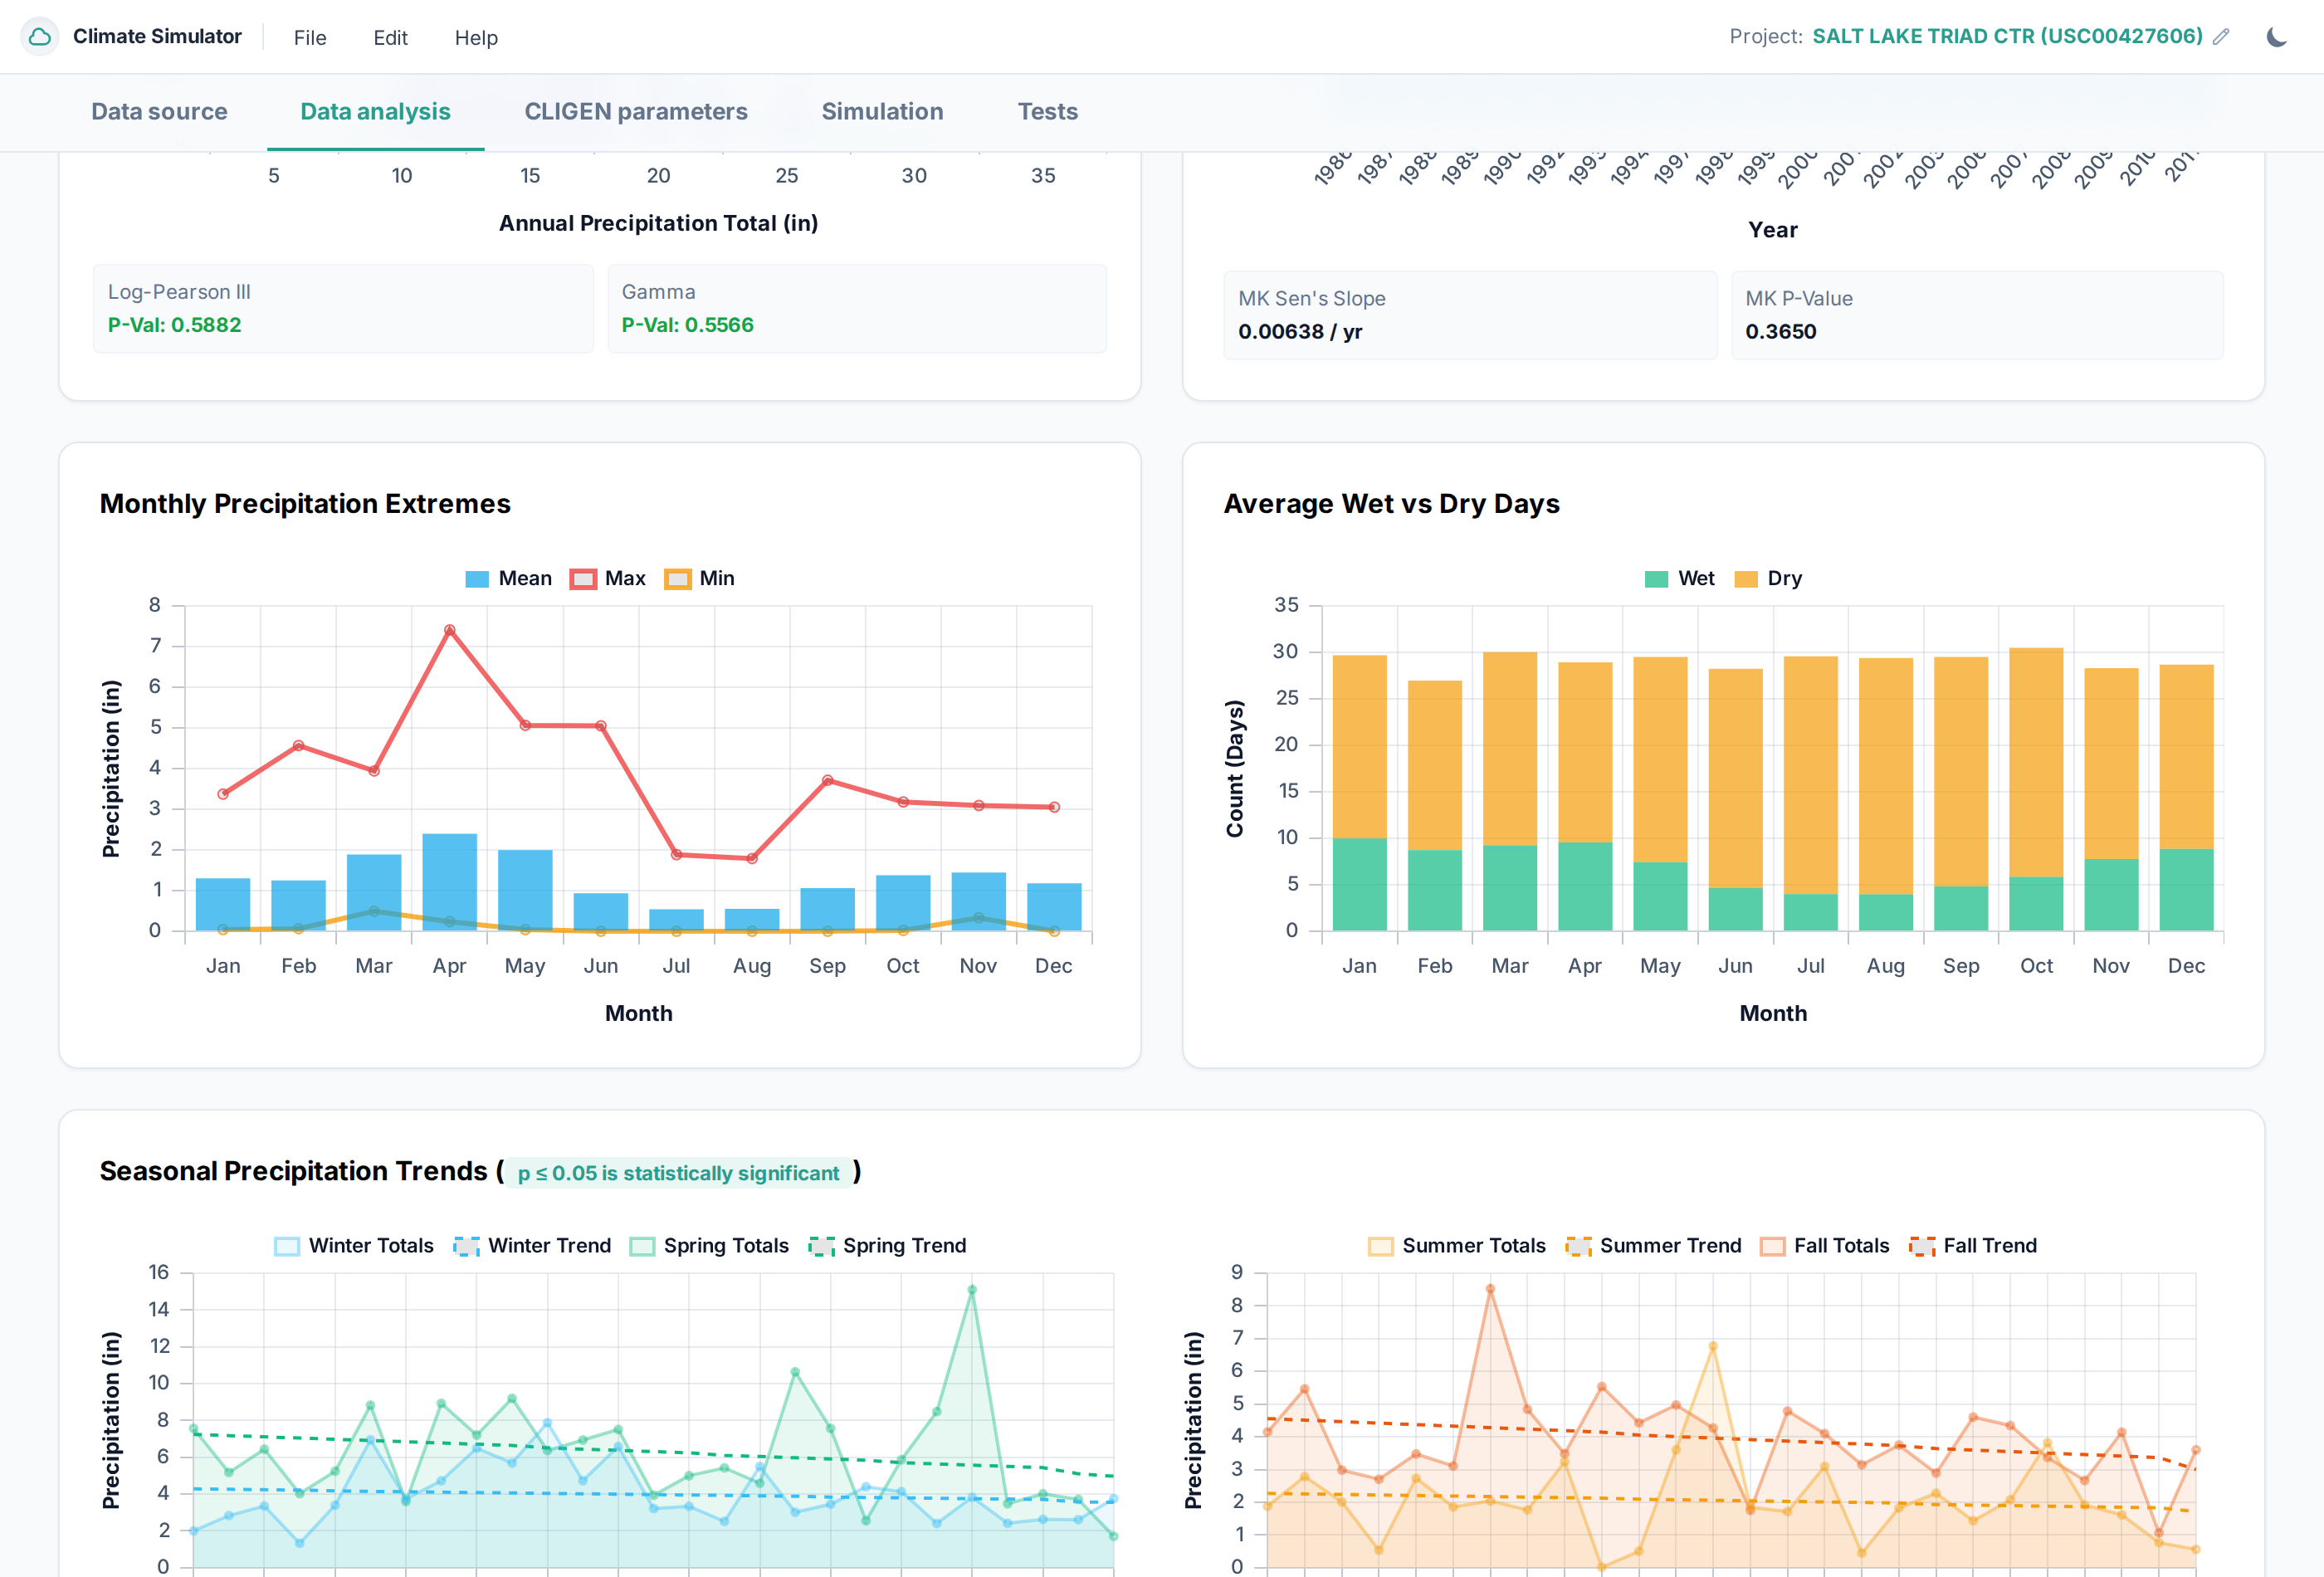 Figure 2: Monthly precipitation extremes (mean, maximum, and minimum monthly totals) alongside average monthly counts of wet days versus dry days.
- Monthly Extremes: Tracks the historical mean monthly rainfall alongside historical wettest and driest months on record.
- Wet vs. Dry Day Breakdown: Displays the average number of rainy days ($P \ge 0.01\text{ in}$) versus sunny dry days per month, revealing seasonal storm frequencies.
- Seasonal Trends: Evaluates trends across meteorological seasons: Winter (DJF), Spring (MAM), Summer (JJA), and Fall (SON).
4. Seasonal Temperature Envelopes (Thermograph)
Switching to the Temperature tab reveals the thermal regime of the site:
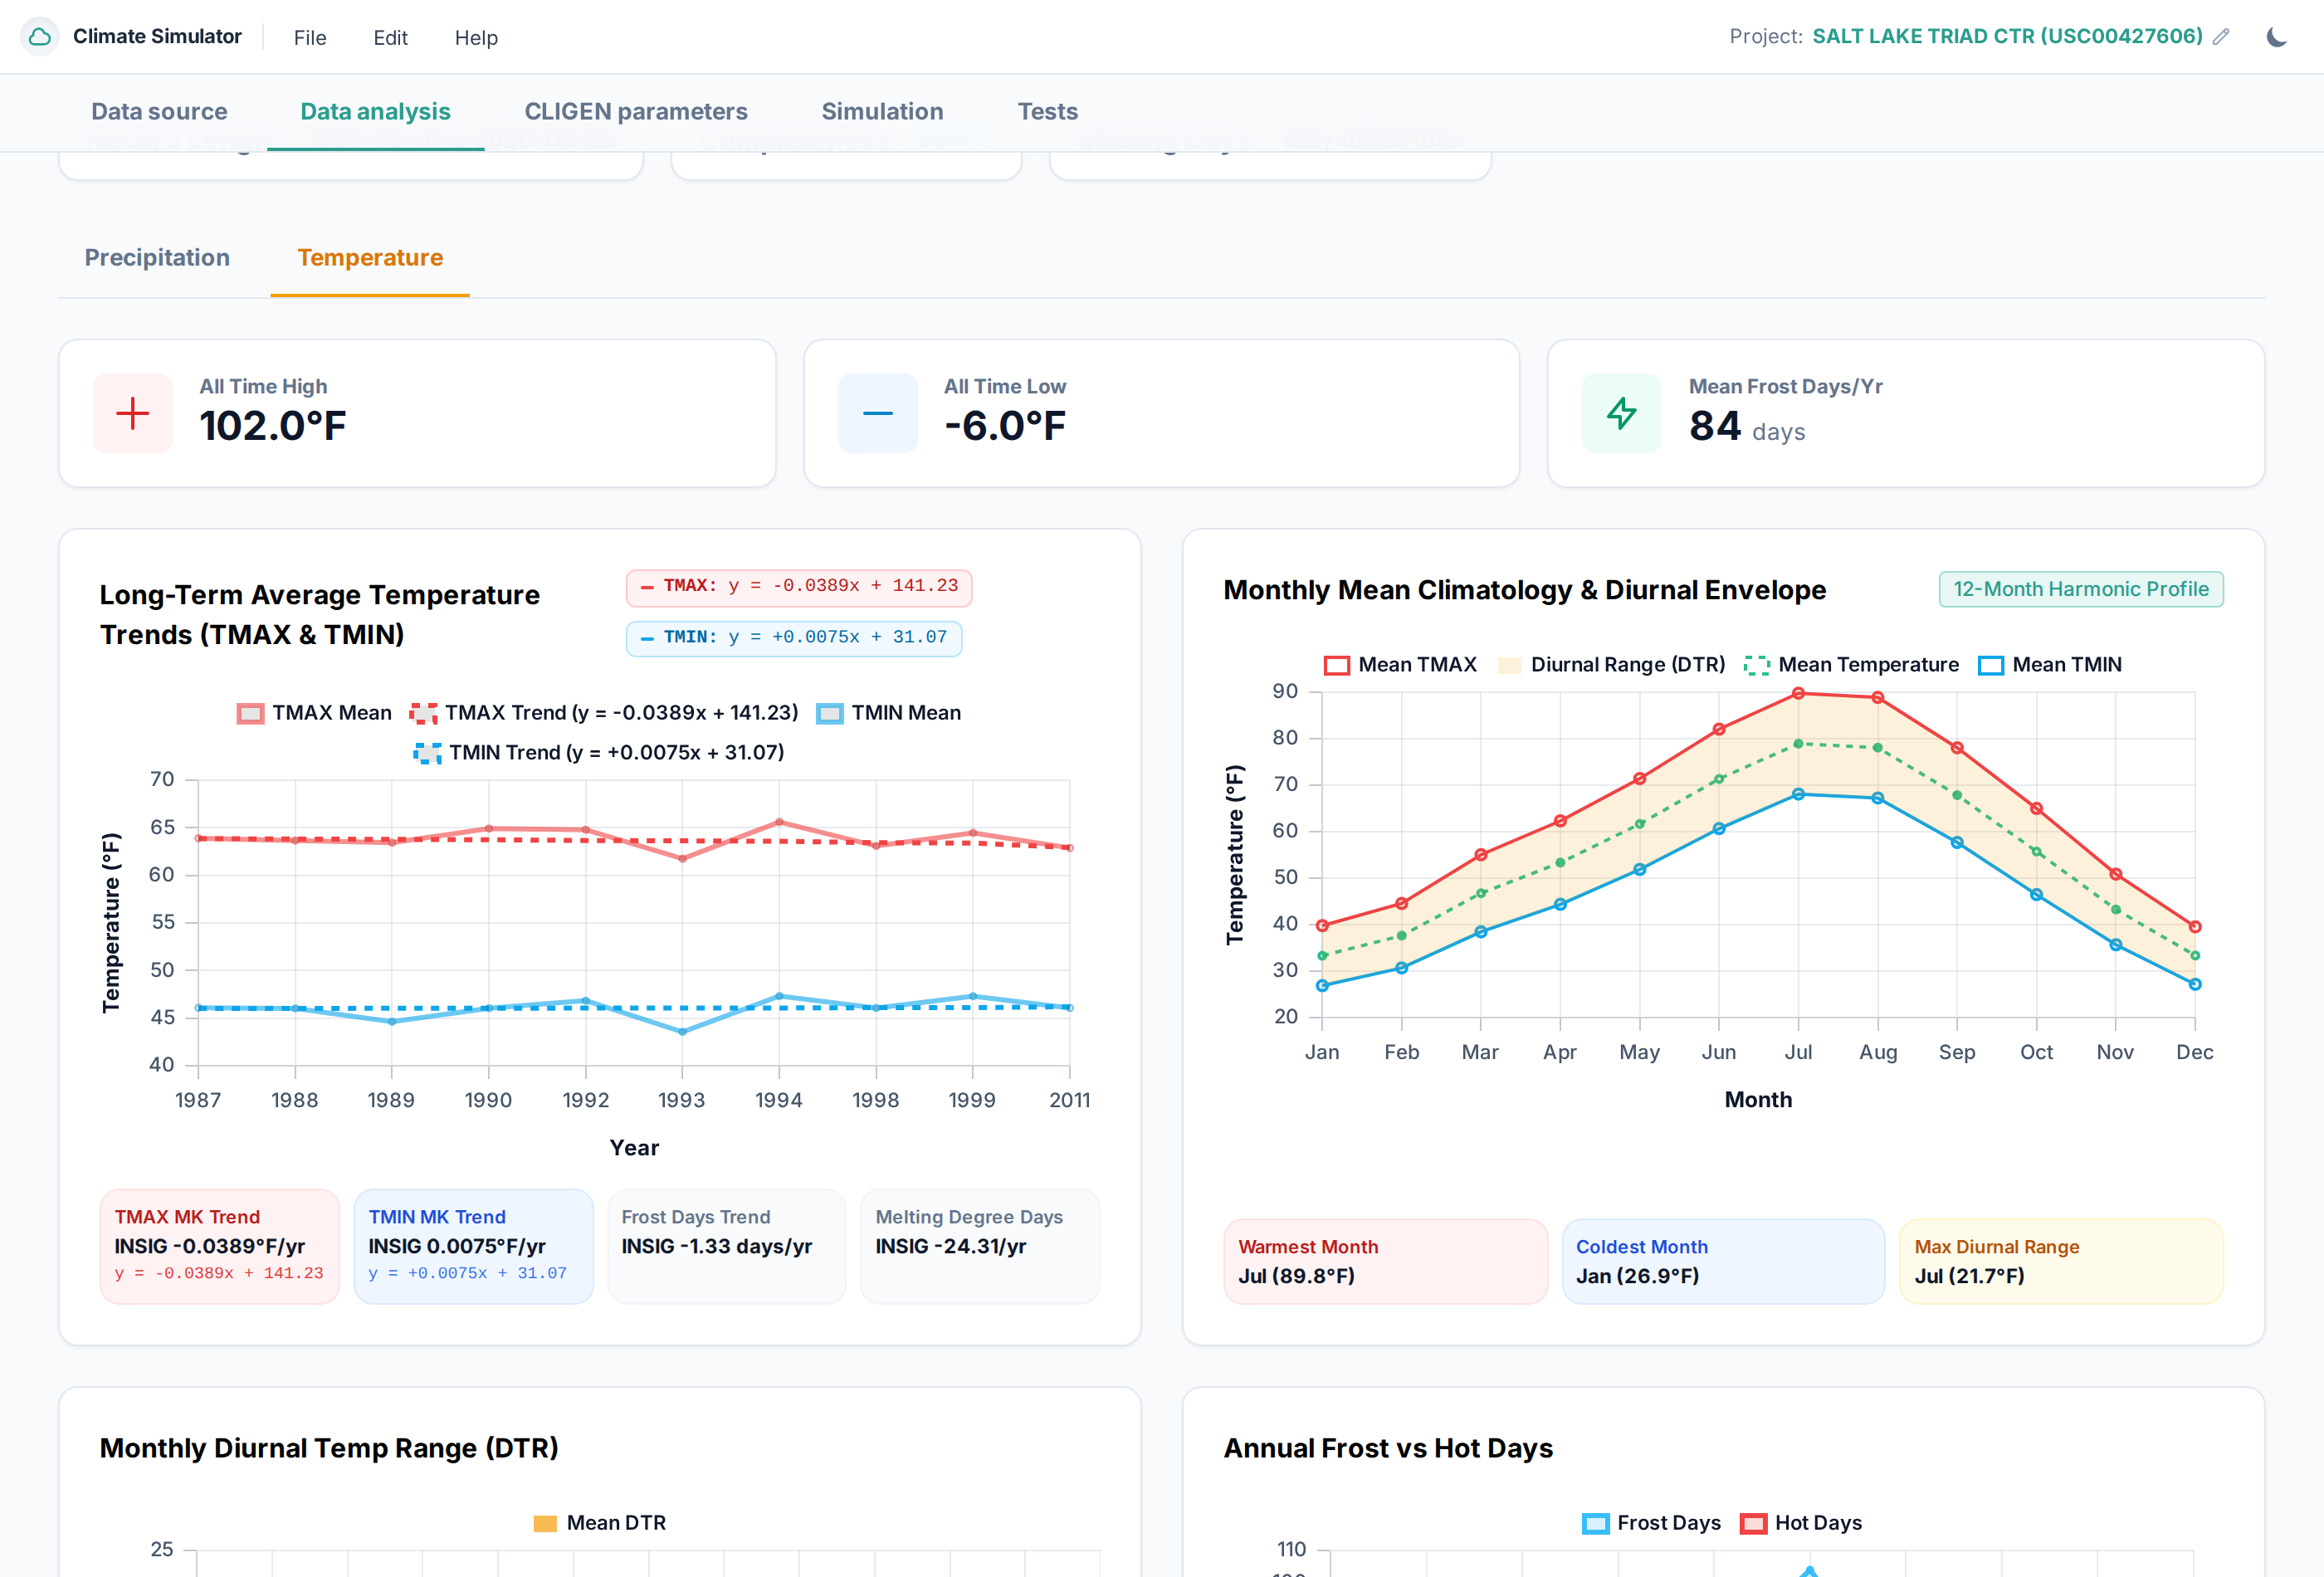 Figure 3: Temperature analysis dashboard featuring all-time temperature records, mean frost days, long-term warming/cooling trends, and 12-month diurnal envelopes.
- All-Time Records & Frost Days: Displays recorded maximums ($102.0^\circ\text{F}$) and minimums ($-6.0^\circ\text{F}$) with clickable occurrence dates, plus average annual frost days ($84\text{ days/yr}$).
- Historical Daily Temperature Time History: Plots daily $T_{\max}$ (red) and daily $T_{\min}$ (blue) together across the full period of record with the same interactive drag-to-zoom, overview brush scrubber, time-window presets (
All,10Y,5Y,1Y,Warmest Yr,Coldest Yr), top extreme heat/cold event jumper, 30-day rolling mean overlay, and freezing threshold reference line ($32^\circ\text{F}$ or $0^\circ\text{C}$). When zoomed out beyond $1{,}500\text{ days}$, the chart uses extremes-preserving buckets (plotting the highest $T_{\max}$ and lowest $T_{\min}$ per bucket) and switches to 1:1 daily points when zoomed in. - 12-Month Climatology & Diurnal Envelope:
- Red Curve ($T_{\max}$): Mean monthly daytime maximum temperature.
- Blue Curve ($T_{\min}$): Mean monthly nighttime minimum temperature.
- Shaded Band: Diurnal temperature range ($T_{\max} - T_{\min}$).
- Warmest and Coldest Months: Identifies peak summer heating (e.g. July at $89.8^\circ\text{F}$) and winter freezing (January at $26.9^\circ\text{F}$).
What to Look For: Sanity Check Checklist
Before proceeding to CLIGEN Parameter Calculation:
- [ ] Are the seasonal wet and dry months consistent with your site's geography?
- [ ] Does the freeze/thaw transition align with local snowpack observations?
- [ ] Are there any unphysically high single-day rainfall spikes caused by gauge errors?
- [ ] Is data completeness high (preferably $> 95\%$)? If not, proceed to the next chapter to apply date filtering.