This tutorial walks through the process of defining a new B-SOAR model scenario, running the model, and view results. We will also add a new scenario with new input data and compare results.
A copy of the B-SOAR GoldSim model has been published on a website, allowing you to interact with it online. The physical GoldSim model runs on a backend server and the web page interacts with it.
Step 1 - Go to the website
Click on this link to go directly to the B-SOAR model website -> B-SOAR Online

Step 2 - Review the Documentation
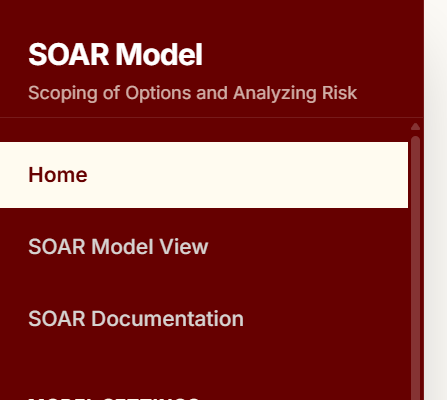
In the left side navigation pane, click on the documentation links to learn more about the model.
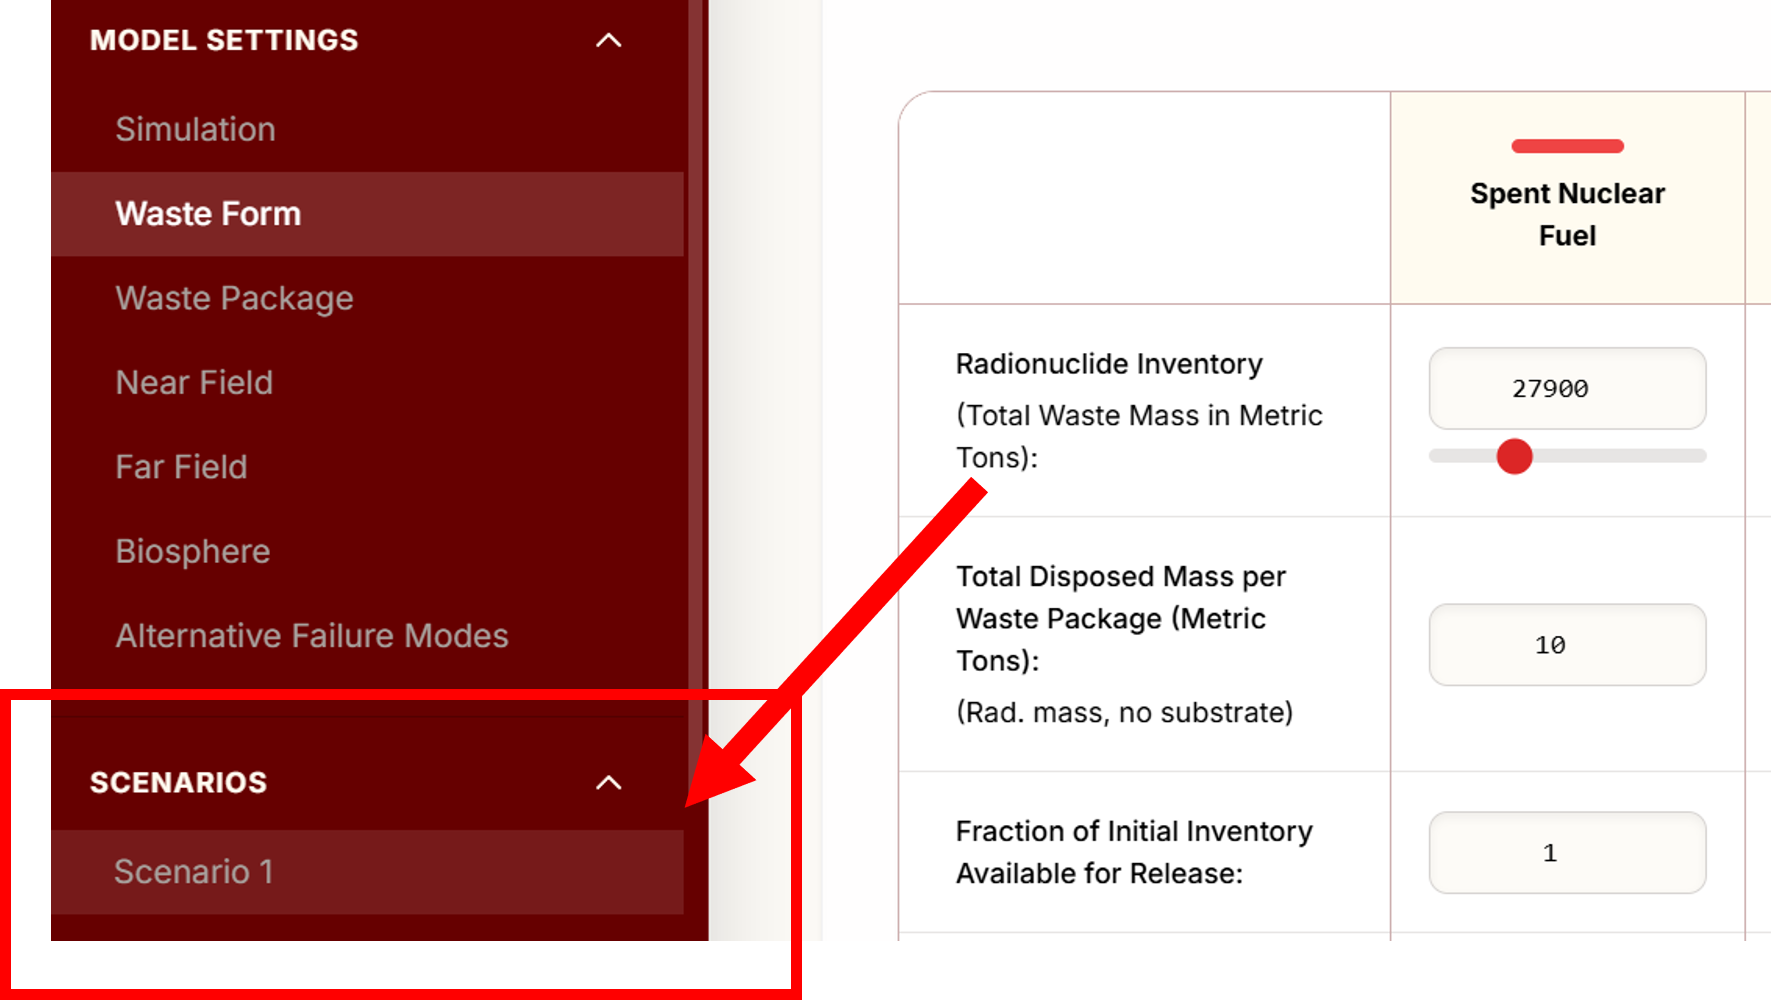
Step 3 - Activate a Scenario
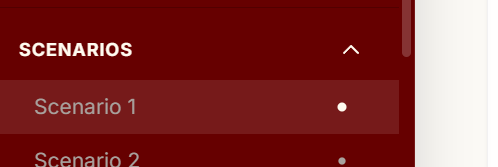
Click on the scenario you want to activate.
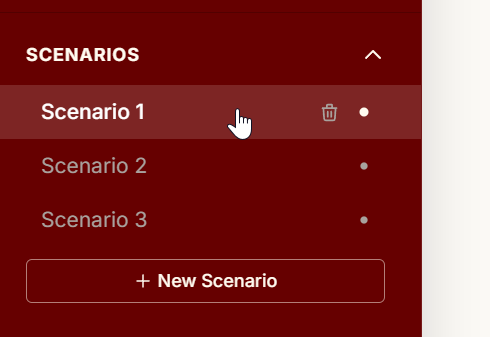
[!NOTE] When a scenario has been run, you will see a white dot to the right of the scenario name.
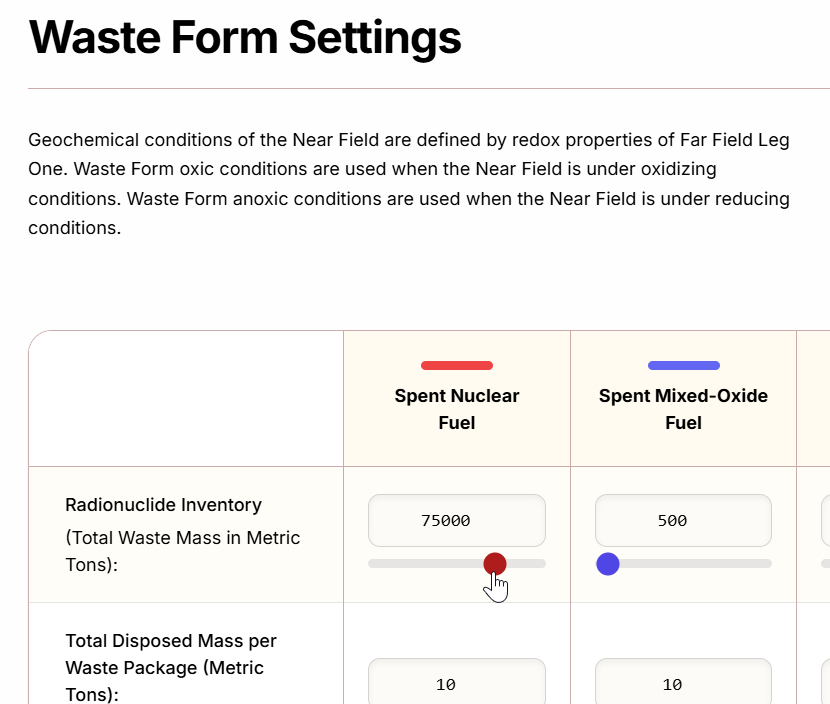
Step 4 - Edit Model Inputs
Set up a new model run by navigating to the input pages and setting the input parameters to suit your specific site settings.
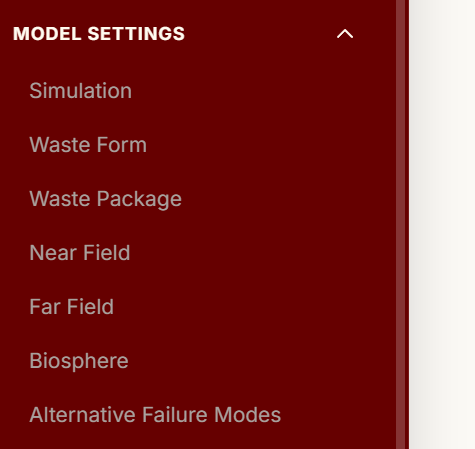
Navigate to each input page to define all the inputs for the model.
[!NOTE] The Simulation Settings page is not yet connected but all other pages are connected to the underlying GoldSim model.
Simply adjust inputs by typing in new values or moving sliders:
After you edit data in the model, you will see that your active scenario does not have a white dot, indicating it doesn't have results yet.
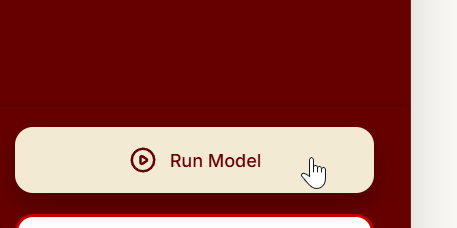
Step 5 - Run the model
After you set up the input parameters for your active scenario, click the Run Model button.
Wait for the model to run on the backend server....
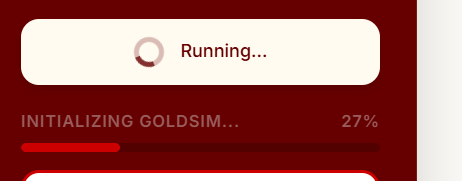
When your simulation is complete, you will see that your active scenario now has a white dot, indicating that it contains results.
Repeat the steps above for multiple scenarios.
Step 6 - View Results
After the simulation is complete, you can navigate the Results pages to see results.
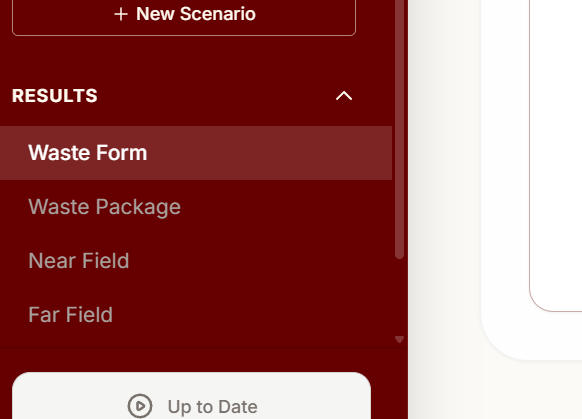
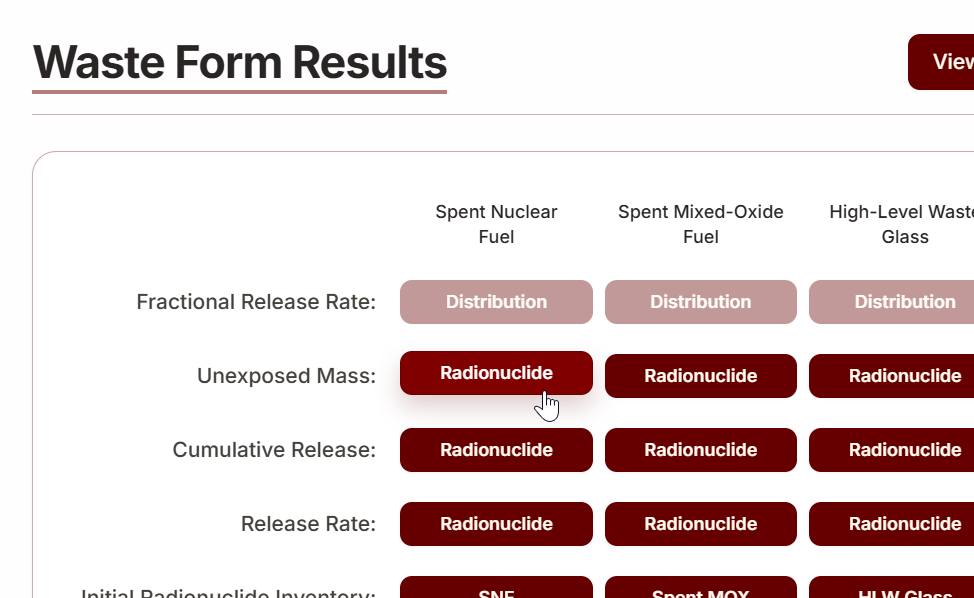
Click on the Result Chart buttons to see a result chart.
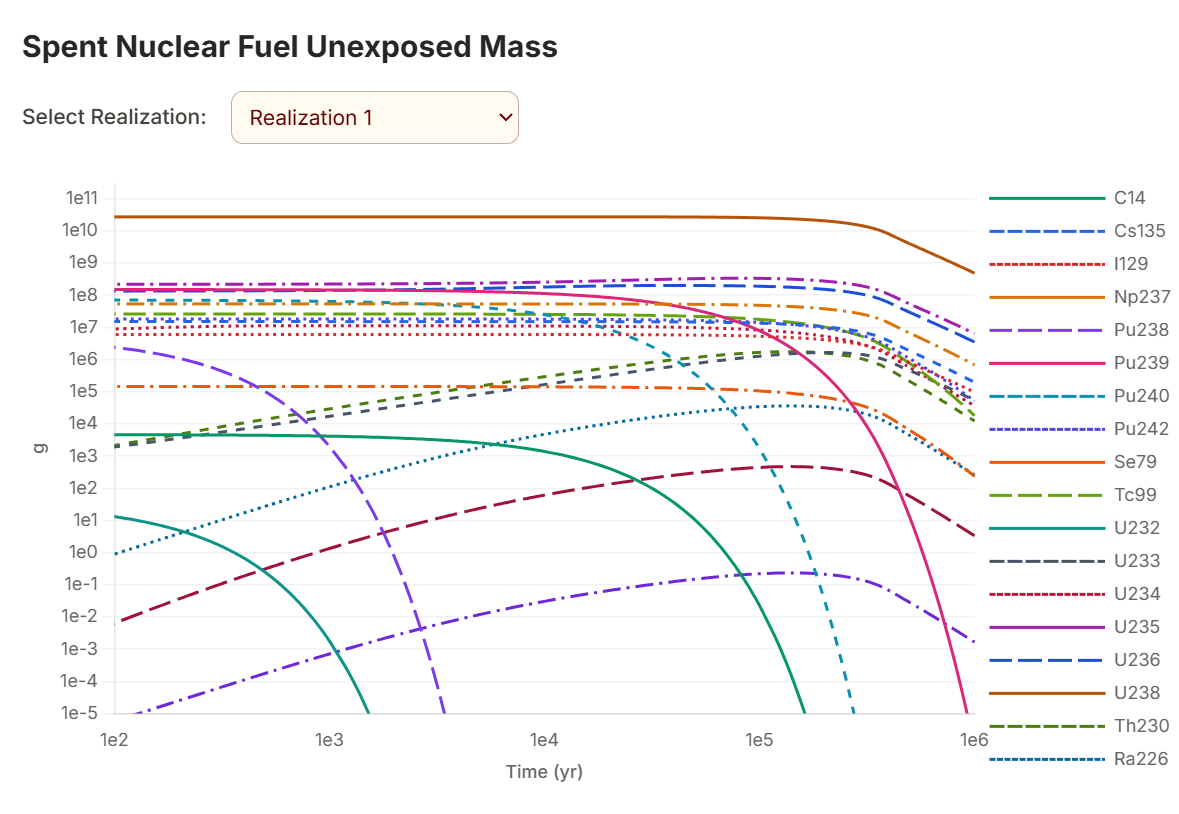
[!NOTE] The model currently is set up to only run Realization 1.
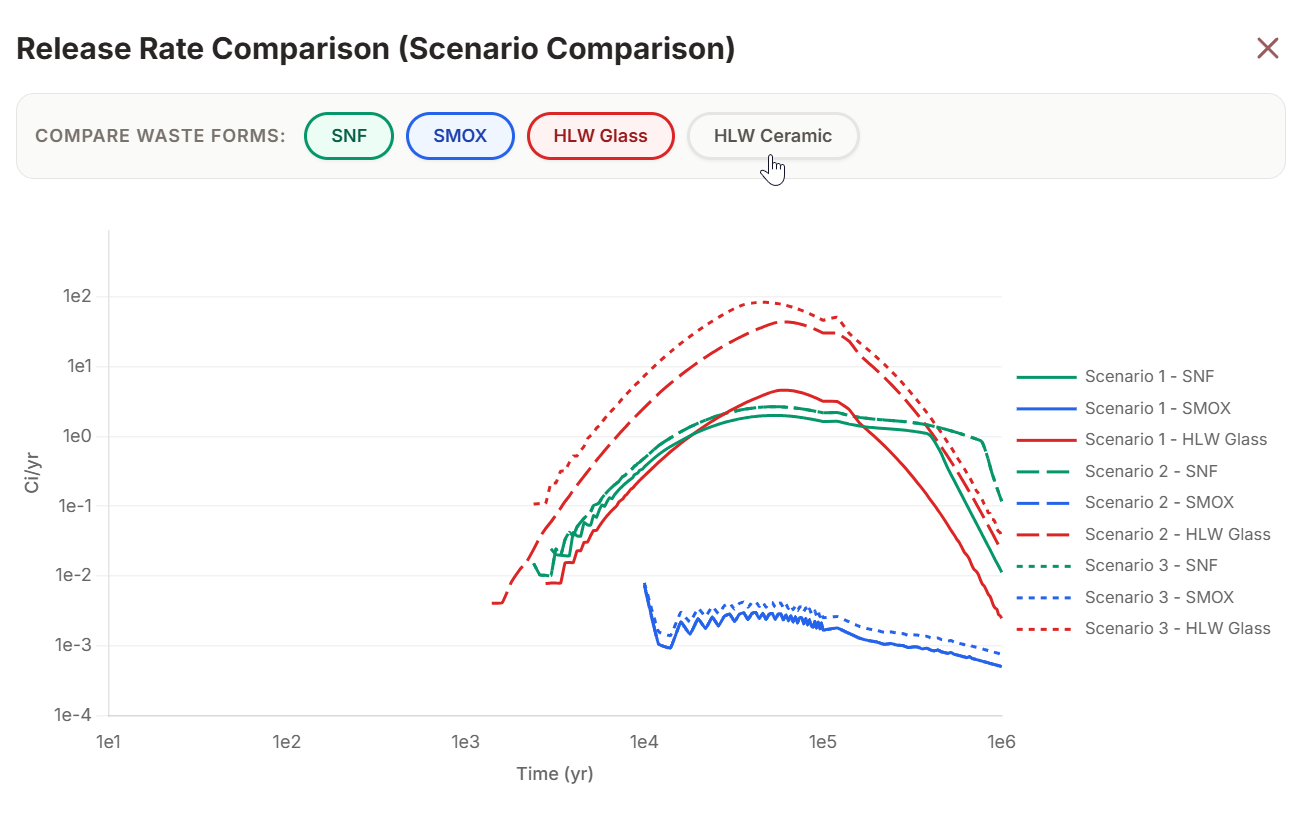
On the Waste Forms Results page, there is 1 scenario comparison chart to allow you to see how results from multiple scenarios compare to each other after you have run multiple scenarios. Solid lines are used for Scenario 1 in this chart.
On the scenario comparison chart, you can select which outputs to compare by clicking on the badges at the top of the chart.